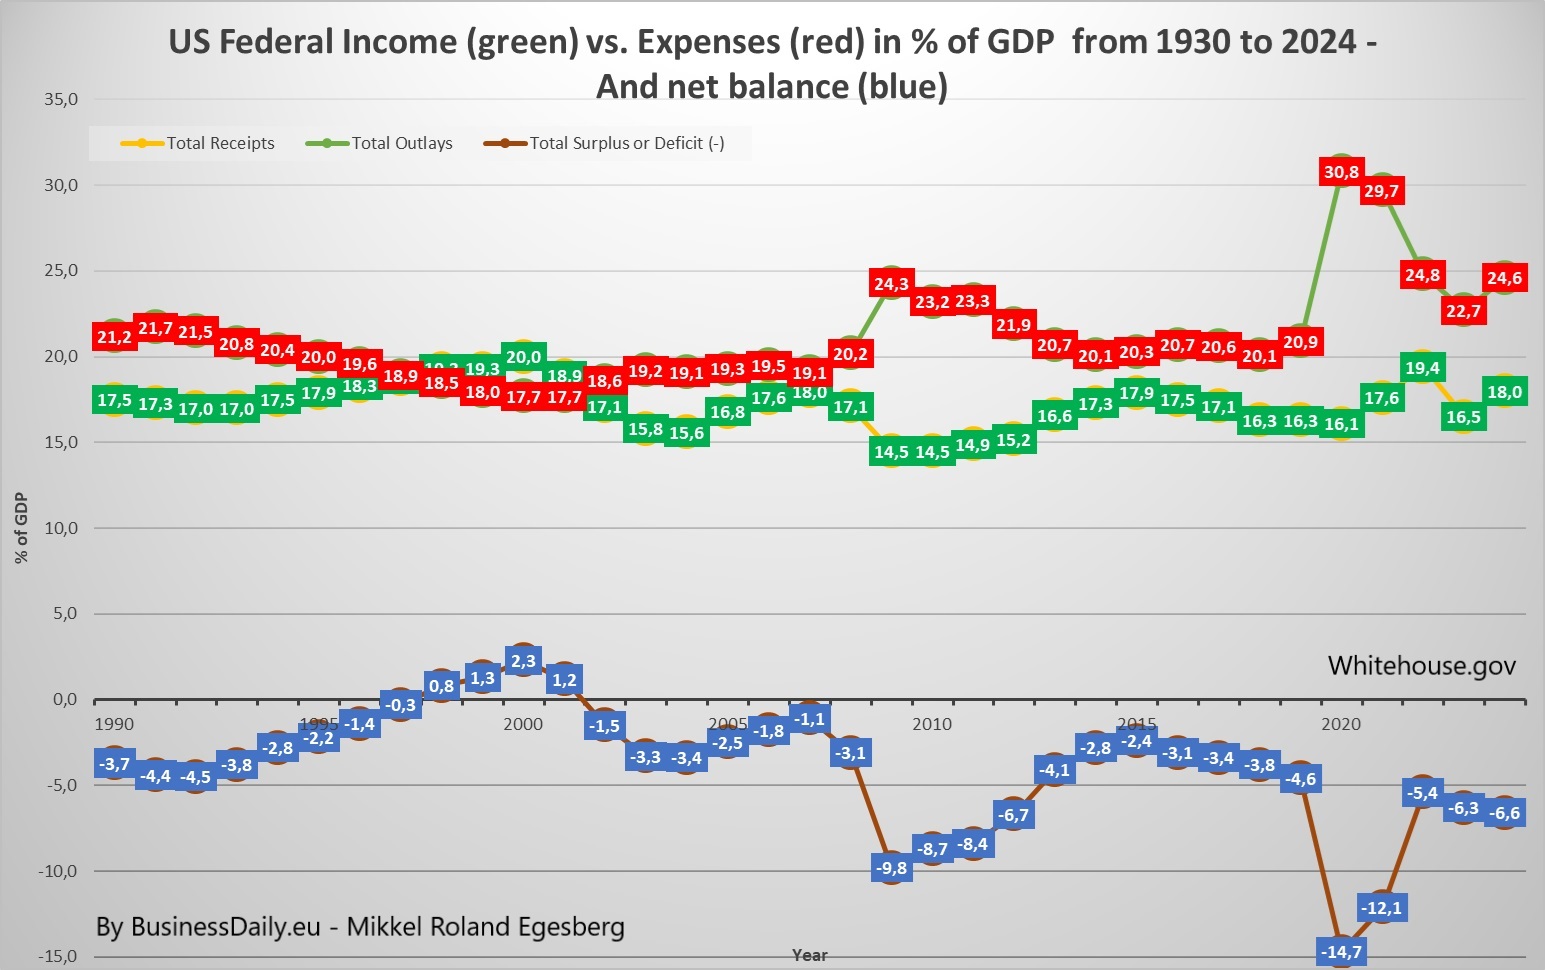
We see that the US Federal government has had deficits in all years from 1990 to 2024, except from in the late 1990'es until 2001 ..then the IT-Bubble busted. All the blue numbers that are below 0, means US Federal-deficits, you can see how big in percentages of GDP, and this is derived by subtrackting the red values (Outlays/Expenses) from the green values (Income).
- The US Federal Government had a Budget-Deficit of 14,7% of the US GDP in 2020! If they borrow money the interests rates are pushed upwards, because of supply and demand of money, so more interest has to be paid off, and if they print money, inflation skyrockets, and the the interest rates has to go up anyway, because of the Fisher-equation, saying the interest rate you get is, also known as the "Real-interest rate", is equal to:
The Real Interest rate = Nominel interest rate - Inflation!
- Without this Massive "Expansionary fiscal policy", the US economy with have been in a Recession, but for how long time can the Americans continue to live on more and more borrowed money? And also relevant, for how long time will the rest of Planet Earth continue to let the US live on "Planetary welfare"!
In the formula above, "G" is the red in the chart i made and "T" is the green, and the Blue color in the chart is is the net balance "T-G".
If "T" is less than "G" you have an "Expansionary fiscal policy". (The Federal Government borrows Money, or FED prints Money)
and if "T"="G" you have a "Balanced budget".
and if "T" is greater than "G" you have a "Contractionary fiscal policy". (The Federal Government saves Money).
The chart above shows the US federal debt as % of GDP (BLUE LINE), and the Total US Federal debt in US Dollars (red bars).
We see that the US loaned a lot of money during World War 2, up to around 120% of GDP, and then repaid some money forward to about 1980, down to around 30 % of GDP, and then the US has pretty much been increasing the debt ever since, except from the late 1990'es until about the IT-Bubble bursted in around 2001, to around 60% of GDP, and then hits aorund 124,3% of Debt to GDP ratio in 2024....
That was debt in percentages compared to GDP. The red bars shows the debt in nominel US Dollars, we see that the amount increase hit hit around 35000 billion US Dollars. We note that the debt in USD did not decline much, while the blue axis did, this means that the GDP goes upwards and the debt remains constant in absolute terms, since the Debt/GDP ratio falls, while the red bars show the debt in absolute terms, so while red bars increases, the debt/GDP ratio fell around 2021, because GDP rose, but please NOTICE, this can happen because of real GDP growth, or just because of inflation rose!..and we all know inflation rose, in short, USA DID NOT DECREASE IT's DEBT (RED LINES - left Y-axis), but Inflation devalued the Debt/GDP ratio and made it decrease (BLUE LINE- right Y-axis)!
- Did the US Payments on interest on US Federal debt reach 24% of the Total Federal Budget in 2021? (Treasury). And about 19% of Total Budget expenses in 2024?
The US "Household Income"-cake divided into five equally same size pieces
Cybercitizen.dk/BusinessDaily - 1. November 2024 -
So Americans love to brag about their socalled high-income earners, the "American Dream"...but how realistic is this?
The US economy is like a football stadium, they are all very poor or sort of, but then ELON MUSK, BILL GATES AND Mark Zuckerberg walks into the stadium in the VIP box - and before no-one in the stadium had an income or more than 5.000 USD a month, on average, but with these 3 topguns, the stadium speaker tells the audience to buy hotdogs and Heineken, because they are all very rich now...on average (GDP per capita). This chart, that I made below, shows that 60% of the US population only earns a combined 25%-points of the US income in total, whereas the rich top 20%-points earns more than half of all the income alone:
Sure the top 20%-points top-earners of Americans sure must make a nice living, but with 60% of the American population combined only earning 25% of the total income, dont bet on the "Average Joe" to be filthy rich, or anything close to it!
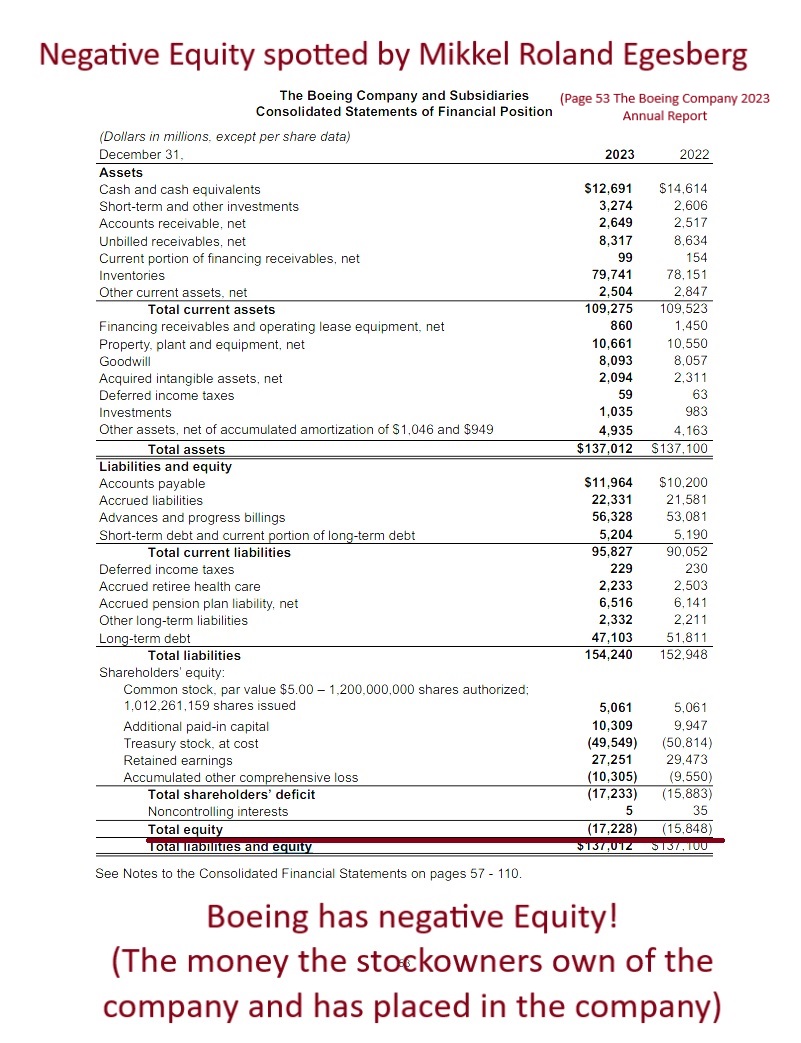
Is the Boeing-company crashing with a free fall velocity?
- Is Boeing already Bankrupt?
Boeing has negative equity, which is the part of the company the stock-owners own in value...By law they can only lose the value of theirs stocks, it would seem, but come on, who wants to pay money for negative equity? Would you pay the full market-cap value of the Boeing Company (BA); Market cap is at 112 Billion USD (1.NOV - 2024). Stock Price is at 149.31 USD, when posted. , just to get to be the owner of around 17 billion USD in net debt?
But remember, eventhough Boeing is losing to Airbus on the private aviation market, Boeing is a Defence/Aerospace company, and we seem to be in a situation with risk of World War 3! When you ask yourself: "Should I buy the Boeing stock?", you should ask yourself: "Do I want to buy on the historic trend, with a loss in the private aviation market etc., saying "Boeing is broke!""? or do I jump on the future trend saying: "World War 3 or little less is here, Boeing as a Defence company will do well!"?
Af Mikkel Roland Egesberg - CyberCitizen.dk: Ovenforståene figur viser Danmarks BNP i perioden 1990 til 2024 i mia. kr., løbende priser, hvilket vil sige "BNP opgjort som seneste Priser * Mængde", hvorimod man ved "Faste Priser", holder priserne konstante fra et vist år, for at korrigere for stigning i BNP, alene på baggrund af stigende priser (Inflation), da det er seneste priser gange mængde, ved løbende priser.
Består Dansk BNP af alene én bager, som producerer 10 brød, som han sælger til 5 kr., er BNP = 10*5 =50 kr.....Stiger priserne fra 5 til 10 er BNP i løbende priser dermed steget til: (10 Brød * 10Kr. = 100 kr.), altså en fordobling af BNP i Løbende priser, fra 50 kr. til 100 KR., selv om bageren, stadig kun sælger 10 brød!
Man kan holde priser fast til eksempelvis 1990 priser, og det er sikkert fint på gær, mel, ketchup, tøj, møbler etc., men med elektronik, TV/Computere/biler f.eks., sker der løbnde forbedringer på kvaliteten, som er svært et korrigere for, dit tv kostede måske 5000 kr. i 1990, og køber du et nyt koster det måske stadig 5000 kr., men det er sikkert af en hel anden kvalitet, som ville have kostet dig en formue i 1990, men nu sælges billigere ....
(Samlede årlige produktion, som består af C + I + G + (X-M),
hvor X-M er handelsbalancen (NX), opgjort som eXport minus iMport, dvs. NX=X-M (Økonomer elsker at kalde det "Overskuddet (eller underskuddet) på betalingsbalancens løbende poster").
Af Mikkel Roland Egesberg - www.CyberJob.dk - 23.03.2025: Ovenforstående tabel viser udviklingen i personer med løbmodtagerjobs i Danmark efter branche fra jan. 2024 til jan. 2025.
Vi ser, at antallet af personer med lønmodtagerjobs inden for "Information og kommunikation" ligger i bunden med hensyn til "Effekt på samlede beskæftigelse", branchen beskæftiger 124.007 i Jan. 2024, men falder med 878, en ændring på minus 0,7%, der trækker den samlede ændring ned med 2,4%, og vi ser, at branchen udgør ca. 4% af den samlede beskæftigelse i Danmark (Januar 2025)....